
A job search metric is a quantifiable measurement used to track progress and improve outcomes across each stage of the application process. Most job seekers count applications sent and call it analytics. That single number tells you almost nothing about why you are or are not getting interviews. Tracking the right job search metrics means measuring conversion rates from application to recruiter screen, from screen to hiring manager, and from final round to offer. Tools like spreadsheets, Google Sheets scorecards, and platforms like Plucktalent give you the structure to do this consistently. Metrics like application-to-interview ratio, networking reply rate, and interview-to-offer cycle time are the numbers that actually explain what is working.
What is a job search metric and why does it matter?
A job search metric is defined as any quantifiable measure that tracks a specific stage or action in the job search process. The term "job search KPI" (key performance indicator) is also used in career coaching and recruiting circles to describe the same concept. Both terms refer to numbers that tell you whether your search is moving forward, and where it is stalling.
Counting applications sent is a vanity metric. It feels productive but gives no signal about quality or fit. Funnel conversion metrics are more useful because they show exactly where candidates drop out of the process. A job seeker who sends 80 applications and gets 2 recruiter screens has a different problem than one who gets 15 screens but zero hiring manager interviews. The number of applications is the same story; the conversion rates tell two completely different ones.

Job search analytics matter because they shift your focus from effort to results. Effort is easy to measure and easy to fake. Results require honest accounting. When you track stage-by-stage conversion, you stop guessing and start diagnosing.
What are the main types of job search metrics?
Job search metrics fall into two categories: outcome metrics and process metrics. Understanding both is the foundation of evaluating job search effectiveness.
Outcome metrics measure external results you do not fully control:
- Recruiter callbacks received
- Hiring manager interviews booked
- Final round invitations
- Offers extended
Process metrics measure actions you control directly:
- Tailored applications sent per week
- Networking conversations initiated
- Follow-up messages sent
- LinkedIn connection requests to target company employees
Process metrics represent controllable actions, unlike outcomes that depend on recruiter schedules, budget freezes, or internal candidates. This distinction matters because outcome-only measurement creates false negatives. A quiet week with no callbacks does not mean your search is failing. It may mean you sent strong applications that are still in review. Tracking process metrics keeps you grounded in what you actually did, not just what happened to you.
Pro Tip: Set a weekly process goal before you set an outcome goal. Commit to sending five tailored applications and booking two networking conversations before you check how many callbacks you received.
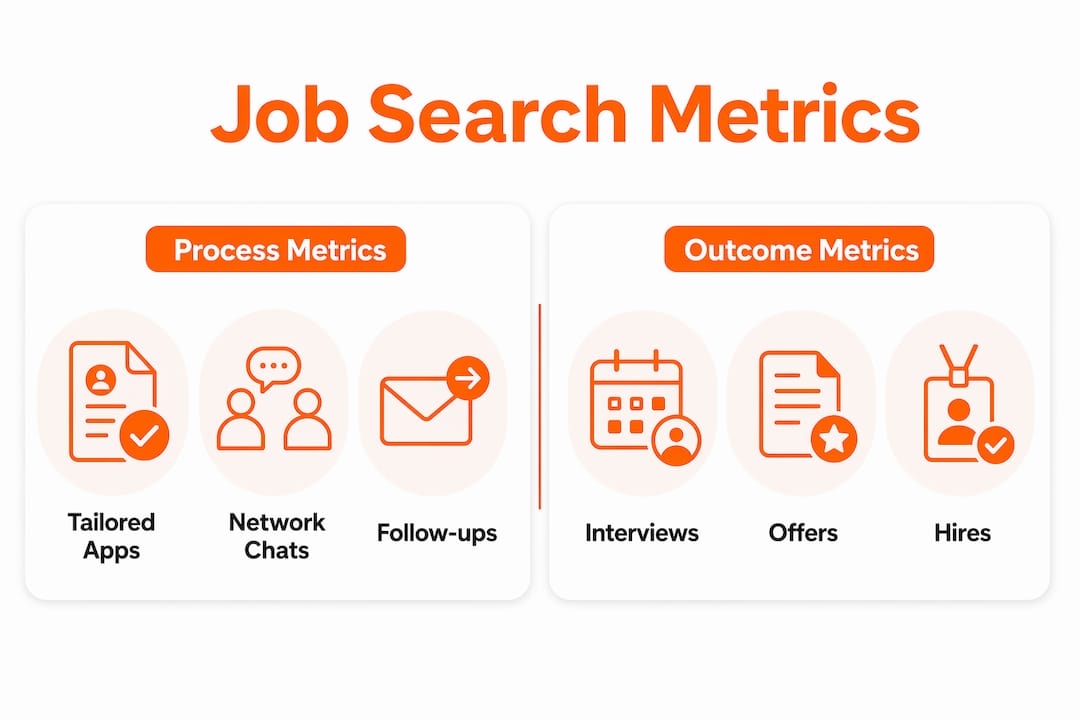
The most effective job seekers track both categories simultaneously. Process metrics show momentum. Outcome metrics confirm results. Neither alone gives you the full picture.
How to apply funnel conversion metrics to your search
The job search funnel has five stages: applications sent, recruiter screens, hiring manager interviews, final rounds, and offers. Each transition between stages is a conversion rate. Tracking these conversions is how you diagnose bottlenecks instead of guessing.
| Funnel stage | Conversion rate benchmark | What a low rate signals |
|---|---|---|
| Application to recruiter screen | 10–20% | Targeting, resume, or ATS issues |
| Screen to hiring manager interview | 40–60% | Role fit or calibration problems |
| Hiring manager to final round | 30–50% | Interview performance or competition |
| Final round to offer | 25–40% | Offer negotiation or final fit gaps |
These benchmarks come from funnel stage analysis reviewed weekly by candidates who track their pipelines. They are not guarantees. They are reference points. If your application-to-screen rate sits below 10%, the problem is almost certainly your resume or your targeting, not your interview skills.
Stage conversion metrics act as routing maps. If recruiter screens never convert to hiring manager interviews, the issue is role-fit or calibration, not application volume. That distinction saves weeks of wasted effort.
Interview-to-offer cycle time is a useful timing metric alongside conversion rates. The median time-to-fill for mid-level US roles is 36 days. That number sets a realistic baseline for how long to wait before following up or moving a role to inactive status in your tracker.
Pro Tip: Build your funnel table in Google Sheets. Update it every Friday. Color-code any conversion rate that falls below the benchmark range. The red cells tell you exactly where to spend your energy next week.
Understanding why job searches take months is easier when you see the funnel clearly. Delays at the hiring manager stage often reflect internal processes, not candidate quality.
How to track job search metrics practically
Tracking job application metrics does not require specialized software. A simple spreadsheet with consistent weekly entries is enough to generate meaningful data.
A basic weekly scoreboard includes these columns:
- Date of application
- Company name and role title
- Application type (tailored or generic)
- Stage reached (applied, screened, interviewed, final round, offer)
- Days since last contact
- Next action and due date
Review this table every Friday. Calculate your conversion percentages by dividing the number of outcomes at each stage by the inputs from the stage before. Ten screens from 80 applications is a 12.5% conversion rate. That number is your baseline. Next week, you improve it or you explain why it dropped.
Micro goals are measurable short-term actions such as sending tailored applications, booking networking conversations, and sending follow-ups. Tracking these as leading indicators builds momentum and prevents the paralysis that comes from staring at an empty inbox. A leading indicator is something you can move today. A lagging indicator, like an offer, arrives weeks later.
Separate volume from quality in your tracker. Volume and quality signals should be tracked separately to clearly distinguish when the problem is low application quality versus insufficient activity. A column labeled "tailored vs. generic" does this job simply. If your tailored applications convert at three times the rate of generic ones, you have your answer on where to spend time.
For IT and cybersecurity professionals, Plucktalent's job search tools are built around this kind of structured tracking, connecting candidates directly with hiring managers rather than routing them through generic job board noise.
Common pitfalls and expert tips for improving your metrics
The single most common mistake in job search analytics is the "one-metric mistake." Focusing only on application count feels productive. It is not. Activity alone does not explain success. Metrics shift effort toward correct failure modes like proof, targeting, and conversion.
Common pitfalls to avoid:
- Sending high volumes of generic applications and calling it progress
- Ignoring networking reply rate as a metric
- Failing to follow up within five business days of an interview
- Treating a quiet week as evidence of failure rather than a data gap
- Measuring only offers and ignoring earlier funnel stages
"Conversion rates are not report cards. They are routing maps. A low screen-to-interview rate tells you to fix your pitch, not to apply to more jobs." — Path Ascent Research
Separating volume from quality is the clearest expert recommendation for improving later-stage conversion. Many applications with zero responses point to targeting issues, not volume problems. If you are applying to roles where your profile is a weak match, no amount of volume fixes that. Targeting improvement means applying to fewer roles with higher fit scores.
Burnout is a real risk in long searches. Tracking process metrics prevents it by giving you something to feel good about on days when outcomes are silent. You sent four tailored applications, booked two networking calls, and followed up on three open threads. That is a productive week by any measure, even with no callbacks.
Job search personalization for tech roles directly affects your quality metrics. A tailored application that speaks to a specific role's requirements converts at a higher rate than a generic resume blast.
Key Takeaways
Tracking both process and outcome metrics across every funnel stage is the most reliable method for diagnosing and fixing a stalled job search.
| Point | Details |
|---|---|
| Define your metrics clearly | A job search metric measures stage-by-stage conversion, not just total applications sent. |
| Track process and outcome separately | Process metrics show controllable progress; outcome metrics confirm external results. |
| Use funnel benchmarks | Application-to-screen rates of 10–20% are normal; below that signals a targeting or resume problem. |
| Build a weekly scoreboard | Update conversion rates every Friday to identify which funnel stage needs attention. |
| Prioritize quality over volume | Many applications with no responses indicate a targeting problem, not an activity problem. |
What the data actually taught me about job searching
I spent a long time watching job seekers treat their search like a numbers game. Send more applications, get more interviews. That logic sounds reasonable. The data does not support it.
The job seekers who moved fastest through the funnel were not the ones sending the most applications. They were the ones who knew their screen-to-interview conversion rate and could explain why it was low. One candidate I worked with had a 22% application-to-screen rate, which is strong. But his screen-to-hiring-manager rate was 18%, well below the 40–60% benchmark. He was getting noticed but not converting. The fix was not more applications. It was interview preparation and role calibration.
The weekly review habit is the single most underused practice I have seen. Most people check their email and feel anxious. Structured weekly reviews replace anxiety with data. You know what stage each role is in. You know how long it has been sitting there. You know what your next action is. That clarity is worth more than any single application.
Process metrics also protect your mental health during a long search. When outcomes are slow, process metrics remind you that you are doing the work. That distinction matters more than most career advice acknowledges.
— Diego
How Plucktalent helps you measure and improve your search
Plucktalent is built for IT and cybersecurity professionals who want their job search to produce results, not just activity. The platform combines 17 years of recruiting expertise with Plucky AI, a dedicated job search co-pilot that connects candidates directly with hiring managers at companies actively hiring for their specific skills. Plucktalent's approach is built around the same funnel logic described in this article. Profiles are ATS-ready and tailored to specific roles, which directly improves application-to-screen conversion rates. For candidates ready to move from tracking metrics to improving them, the Plucktalent job seekers page is the right starting point.
FAQ
What is a job search metric in simple terms?
A job search metric is a number that measures a specific part of your job search, such as how many applications led to interviews or how many networking messages received replies.
What is a good application-to-interview conversion rate?
An application-to-recruiter screen rate of 10–20% is considered a normal benchmark. Rates below 10% typically signal resume, targeting, or ATS alignment issues.
How often should I review my job search metrics?
A weekly review is the most effective cadence. Updating your funnel data every Friday gives you enough information to adjust your approach before the next week begins.
What is the difference between process and outcome metrics?
Process metrics measure actions you control, like tailored applications sent or networking conversations booked. Outcome metrics measure external results, like callbacks and offers received.
How long does a typical mid-level job search take?
The median time-to-fill for mid-level roles in the US is 36 days. Job seekers should factor this timeline into their expectations when tracking interview-to-offer cycle time.